Agency Utilisation Rate Benchmarks by Role (and How to Set Yours)
A good agency utilisation rate depends on the role: around 70–80% for designers and developers, 30–45% for account and project managers. Here's how to set yours.
 Paul · · 2 min read

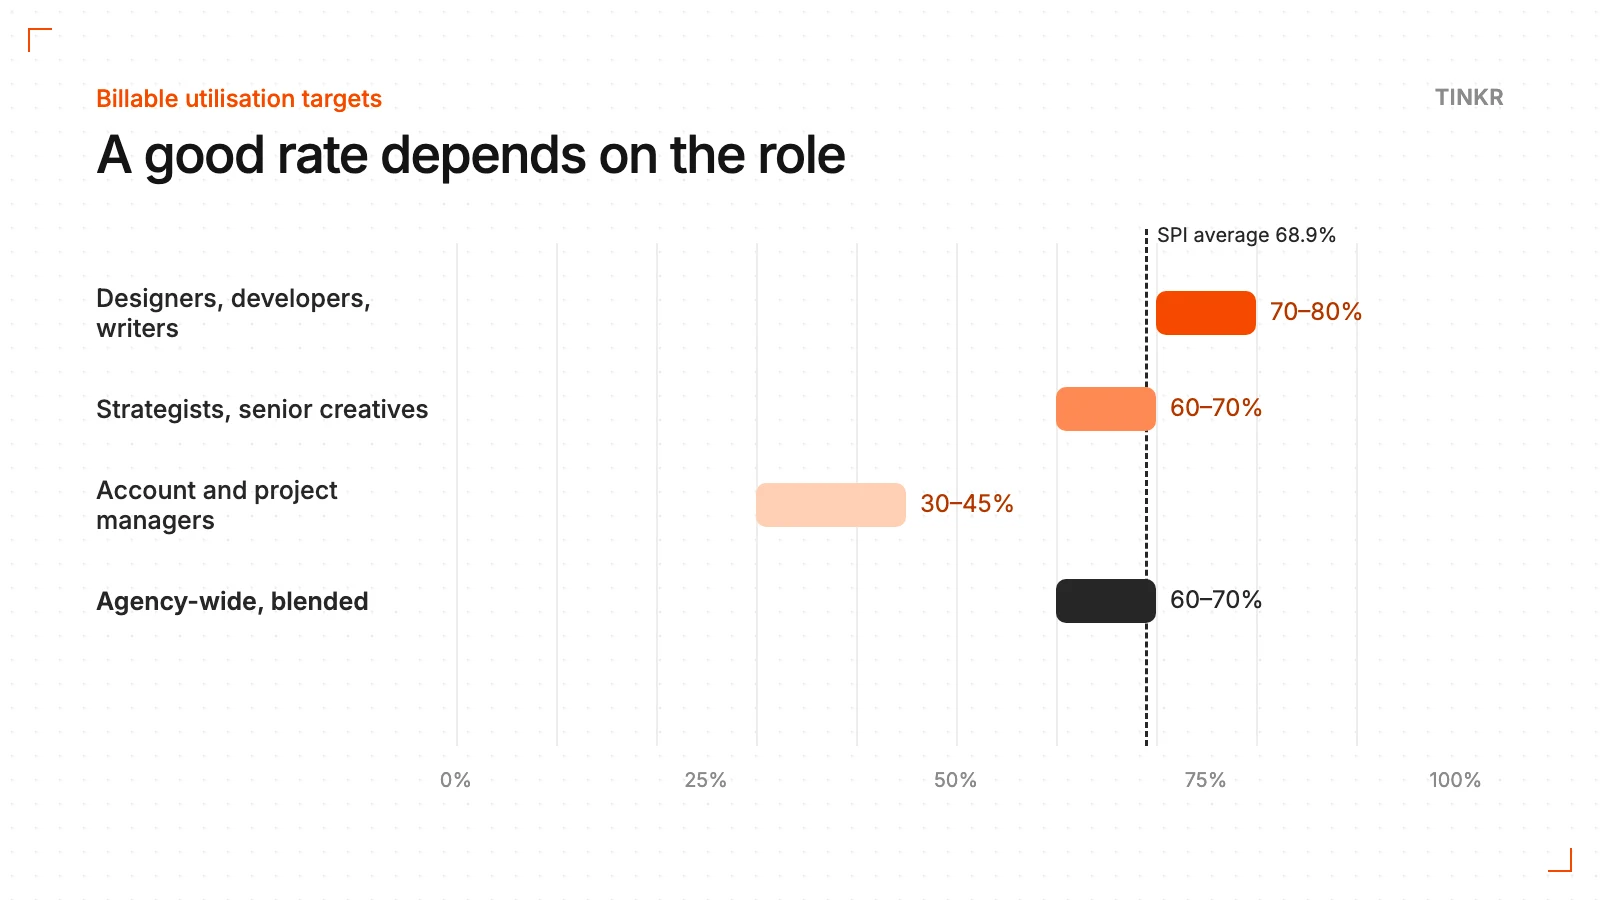
A good agency utilisation rate depends on the role. People who make the work, like designers, developers and copywriters, typically target around 70–80% of their hours on billable work. Account and project managers sit much lower, around 30–45%, because their job is coordination. Agency-wide, a blended figure of 60–70% is a common healthy range.
Those ranges come from agency software vendors that publish targets, not from a formal industry study, so treat them as a starting point. The most rigorous cross-industry number is SPI Research's 2025 Professional Services Maturity Benchmark: across 403 firms, average billable utilisation was 68.9%, below the 75% that SPI treats as optimal.
Benchmarks by role
| Role | Typical target | Why |
|---|---|---|
| Designers, developers, copywriters | 70–80% | Most of their week should be client work |
| Strategists, senior creatives | 60–70% | More time on pitching, thinking and reviews |
| Account and project managers | 30–45% | Their value is coordination, which often isn't billable |
| Founders | No fixed target | Billing a lot of founder time usually means nobody is running the agency |
Why one agency-wide number misleads you
An agency-wide 65% can hide a designer at 95% heading for burnout and an account lead at 20% doing invisible admin. Averages smooth out exactly the problems you need to see. Track utilisation per person and per role, then look at the blended number last.
How to set your own targets
- 1Track everything for four weeks, billable and non-billable, while work is flowing normally.
- 2Look at what each role actually achieves. That's your baseline, not the benchmark.
- 3Set the target slightly above the baseline, not at the industry figure. A 10-point jump in a quarter is not realistic.
- 4Check realisation alongside it. Hours worked aren't hours paid for. See utilisation vs realisation.
- 5Review monthly, per person, and ask what got in the way before asking people to work more.
How to raise utilisation without burning people out
The fastest gains rarely come from people working harder. They come from removing the non-billable work that shouldn't exist: re-typing data between tools, chasing approvals, compiling reports by hand. At Bandit Studio, automating the weekly time-log compilation alone removed about two hours of manual work every week.
Plan capacity a week ahead so producers aren't waiting on briefs. Here's a simple weekly resource planning system.
— Paul
Want this looked at in your own company?
A free 30-minute call about how work, data and approvals move through your company today.